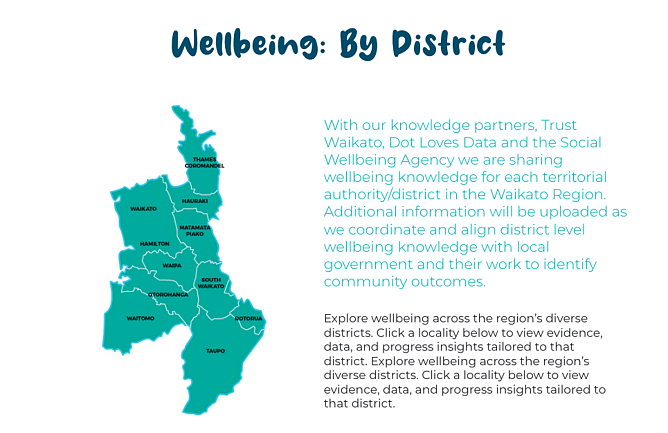
Recently we have been sharing a district-by-district wellbeing snapshot of the Waikato, using one of our most useful (and still under-used) data tools: the Community Compass reports, produced by Justin Lester and the team at Dot Loves Data.
These reports bring together strong quarterly data across housing, employment, business activity, crime, education, and broader wellbeing indicators. But their real value is not just in the numbers themselves—it is in what sits behind them.
They help surface the underlying dynamics shaping outcomes in each district: the structural pressures, local conditions, and interacting factors that are often invisible in headline statistics or high-level regional summaries.
In doing so, they support a shift in thinking—from simply asking “what is happening here?” to “what might be driving it?” and “where is it worth looking more closely?”
The reports are drawn from a much larger data platform developed by Dot Loves Data, which brings together and analyses a wide range of official datasets. We are very grateful to Justin and the team for making these district-level summaries available for wider use and sharing.
Every quarter, we publish the latest Waikato district reports on our website, providing a simple way to track change and patterns over time across the region.
You can access the full Q2 2026 set here: Te Ara Poutama Waikato | Waikato Wellbeing Project | Wellbeing Waikato.
If you work in, support, or simply care about Waikato communities, these reports are well worth exploring.